Focus Areas
Focus Areas is the prioritized work hub in FunnelStory — it surfaces the accounts that need attention most, along with their signals, health trends, and AI-generated action cards, all scoped to a specific slice of your book of business.
How It Works
Focus Areas applies a focus mode to filter and rank accounts, then presents that slice across tabs. The same mode drives every tab, so the accounts you see across tabs are always the same set.
Admins can also inspect another user's book of business by switching to User's Book of Business mode and selecting a team member from the picker that appears.
Tab count depends on the mode. In My Book of Business, User's Book of Business, and the Top 10/20 modes, all four tabs appear: Overview, Revenue Review (or Renewal Pipeline), Needle Movers, and Actions. In All Accounts mode, only the account-list tab and Actions appear — Overview and Needle Movers are left out, since the point of that mode is to scan the whole workspace's table directly rather than a portfolio summary.
Choosing a Focus Mode
The focus mode dropdown at the top of the page controls which accounts are shown. Select the mode that matches your current task:
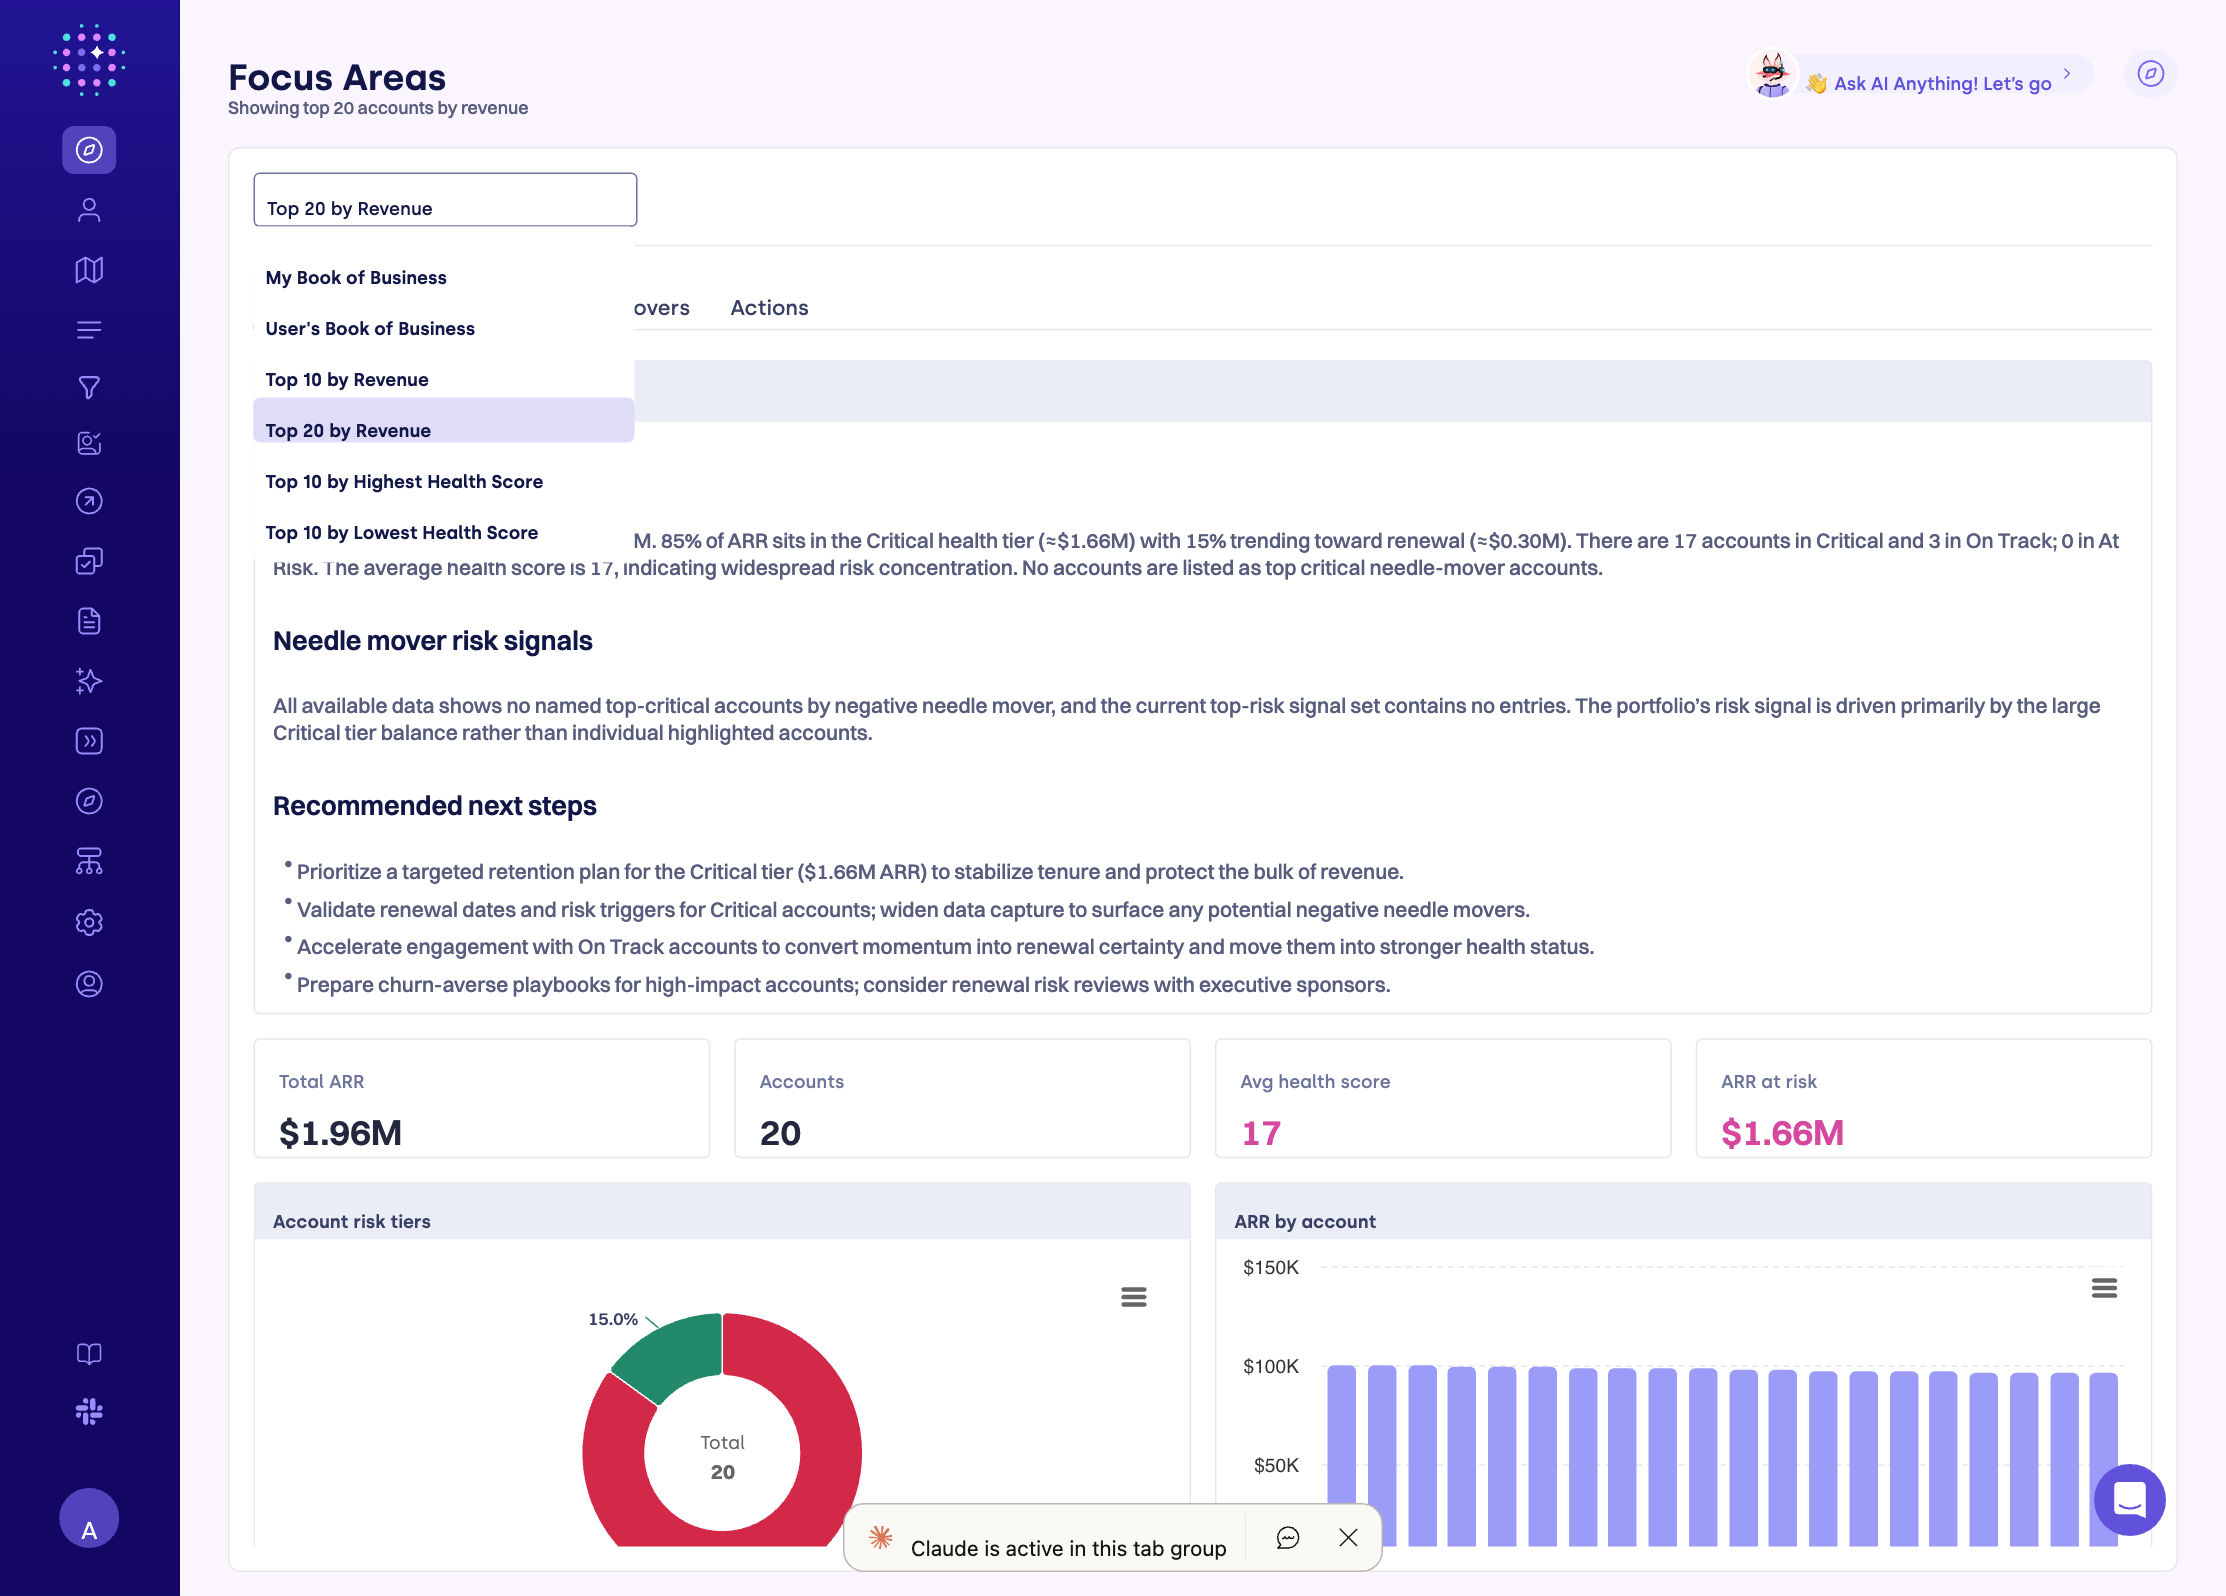
| Mode | What it shows | Access |
|---|---|---|
| My Book of Business | Your assigned accounts, sorted by revenue (up to 100) | All users |
| User's Book of Business | Another user's assigned accounts | Admins only |
| Top 10 by Revenue | The 10 highest-ARR accounts in the workspace | All users |
| Top 20 by Revenue | The 20 highest-ARR accounts in the workspace | All users |
| Top 10 by Highest Health Score | The 10 accounts with the best health scores | All users |
| Top 10 by Lowest Health Score | The 10 accounts with the worst health scores — useful for churn risk triage | All users |
| All Accounts | Every account in the workspace, opened directly on the Revenue Review tab | Admins and Super Admins only |
If you have no accounts assigned, the My Book of Business and User's Book of Business options are hidden. The page defaults to Top 20 by Revenue.
The All Accounts mode is only visible to users with Admin or Super Admin roles. It opens the Revenue Review tab showing the full workspace account list, making it useful for org-wide coverage audits and relationship risk reviews across all CSMs' books.
Tabs
Overview
The Overview tab gives you a portfolio-level read on the selected account set.
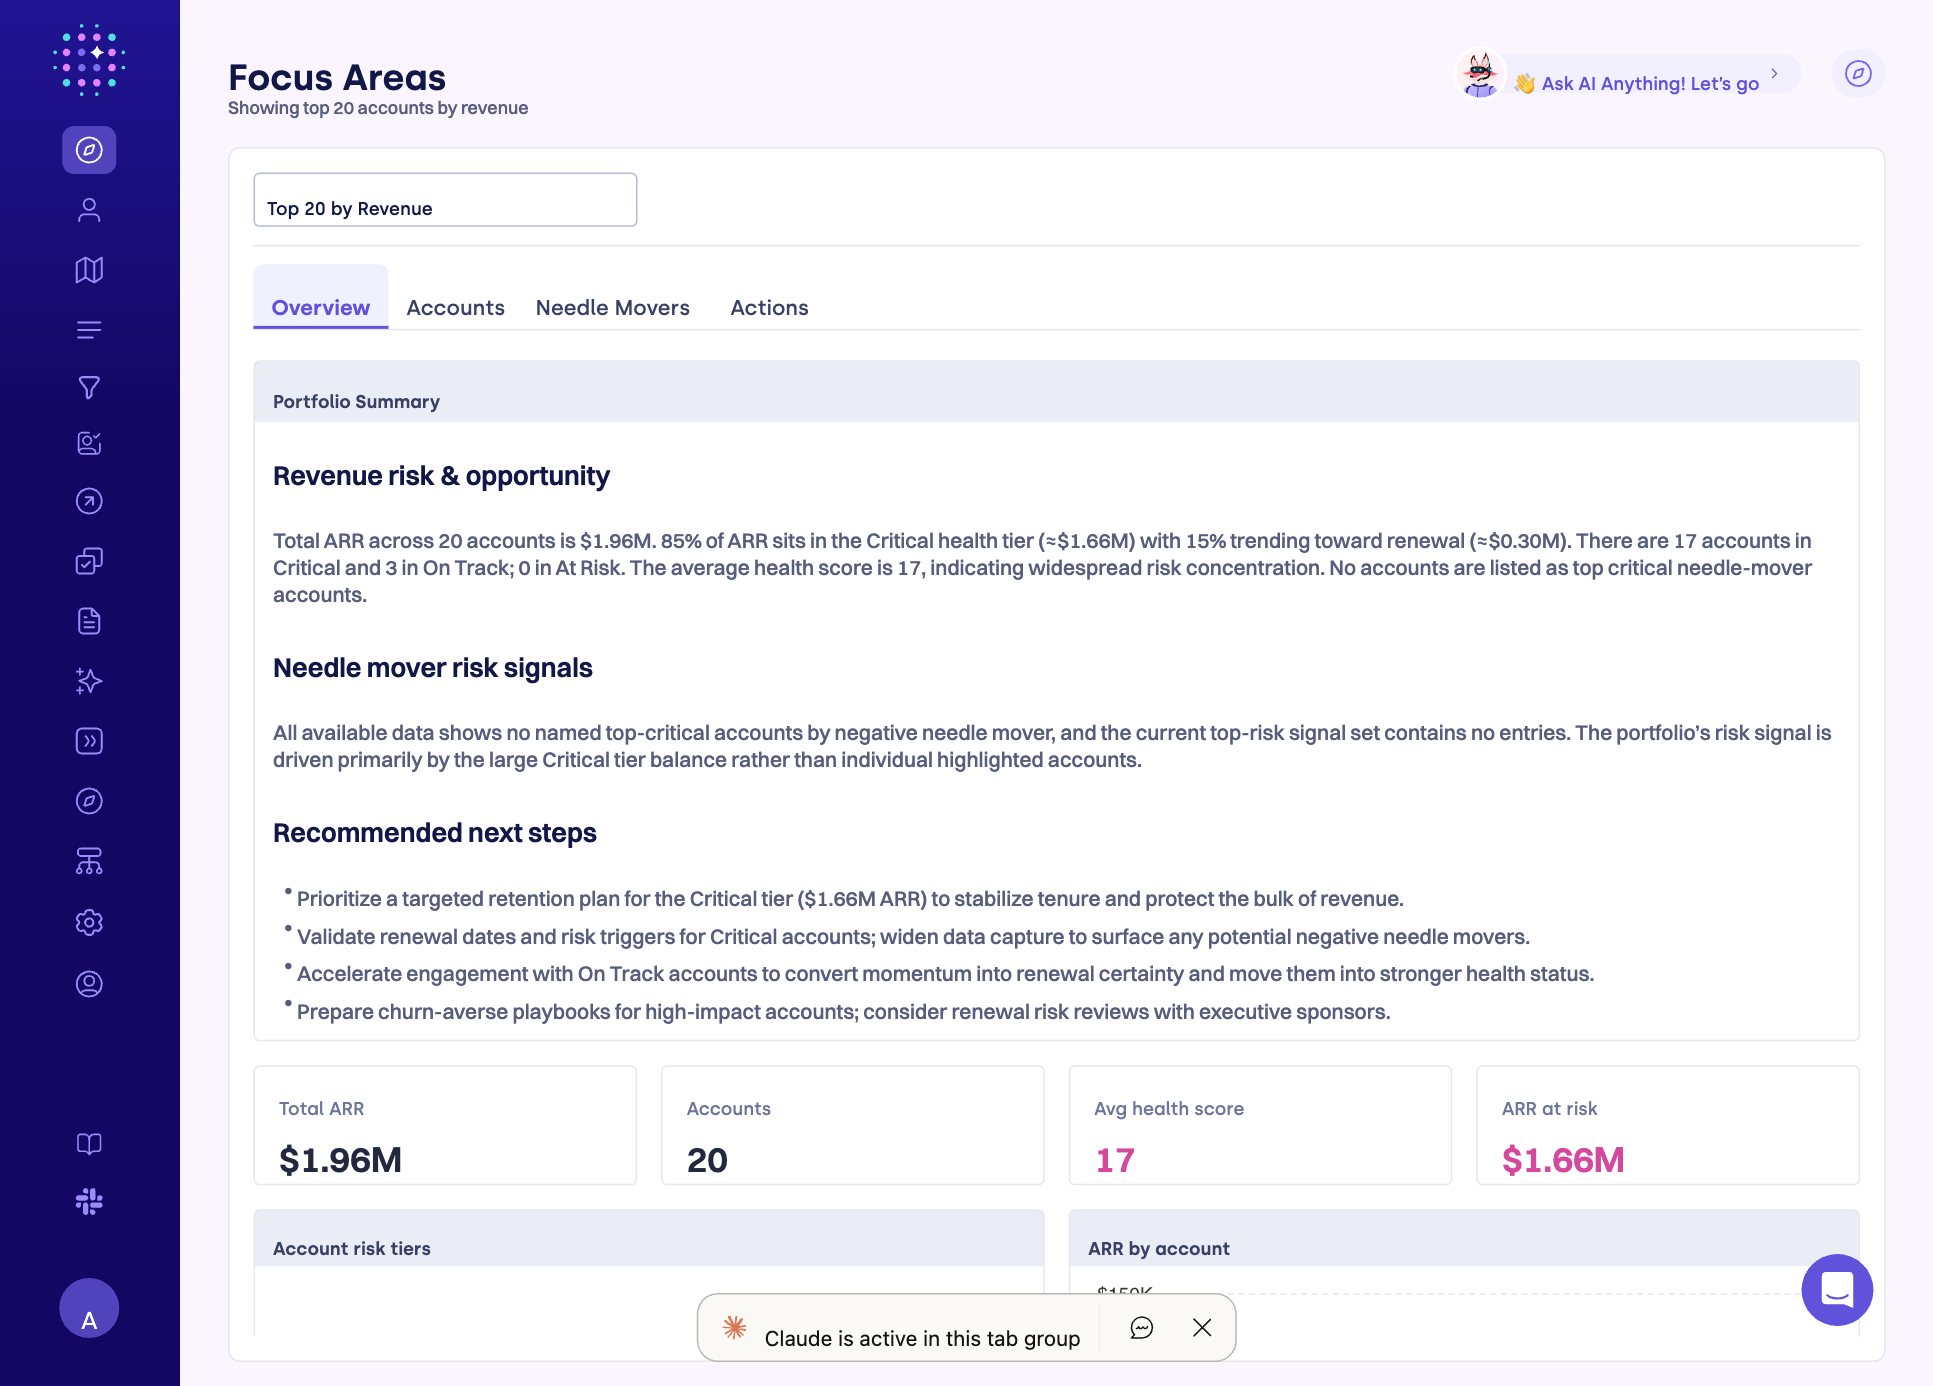
- Portfolio Summary — An AI-generated narrative summarizing the health, risks, and trends across the accounts in view. The summary updates each time Focus Areas loads.
- Stat cards — At-a-glance metrics: total ARR, total accounts, average health score, and ARR at risk.
- Charts — Four visualizations arranged in a two-column grid:
- Account Risk Tiers — Pie chart breaking accounts into Critical, At Risk, and On Track.
- ARR by Account — Bar chart ranking accounts by annual recurring revenue.
- Health Score by Account — Bar chart showing each account's health score, color-coded by tier.
- Revenue by Risk Tier — Pie chart showing how much ARR sits in each risk category.
Revenue Review
The Revenue Review tab gives you a deep, account-by-account view of your entire book of business — combining deal data, AI health signals, and relationship risk in a single sortable table with expandable rows.
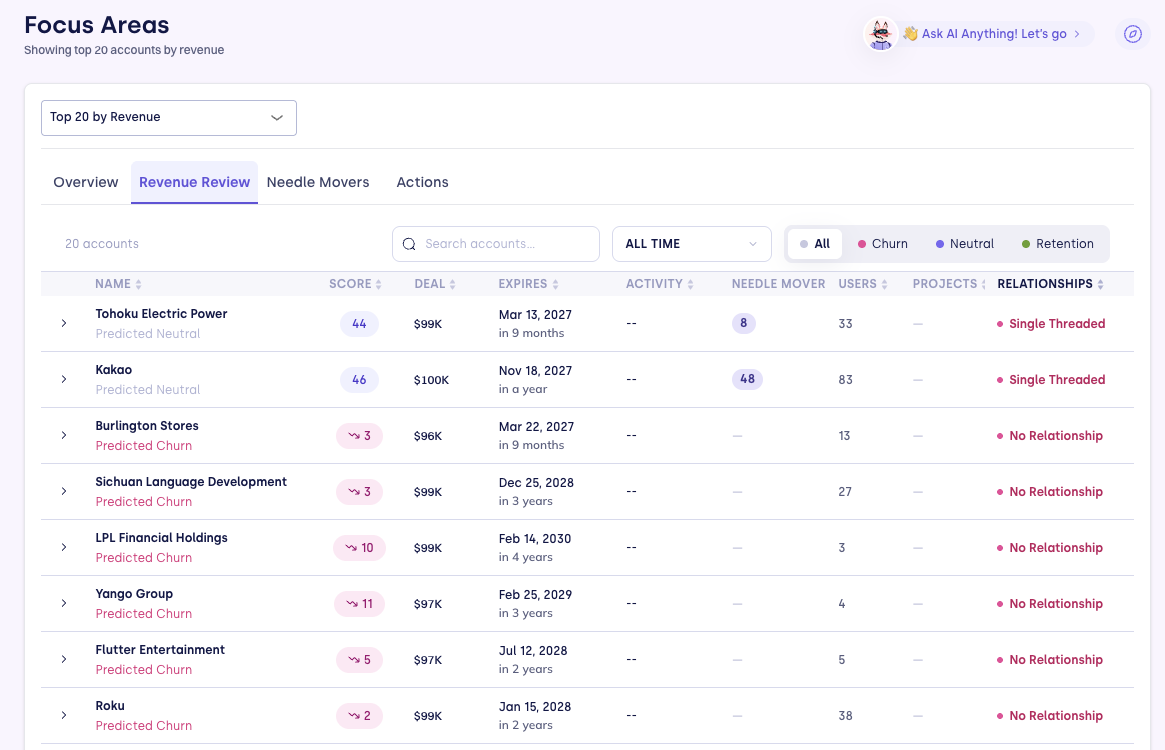
Table columns
| Column | Description |
|---|---|
| Name | Account name and AI-predicted outcome (Predicted Churn, Predicted Neutral, Predicted Retention). Sortable. |
| Score | AI health score (0–100). Low scores with a downward arrow indicate churn risk. |
| Deal | Contract value (ARR). |
| Expires | Renewal date and relative time until renewal (e.g., in 9 months). |
| Activity | Recent activity signal. |
| Needle Mover | Count of open Needle Movers for the account. |
| Users | Number of tracked users at the account. |
| Projects | Number of active projects. |
| Relationships | Relationship risk classification — Single Threaded, No Relationship, or healthy. |
| Actions | Count of open Action Cards for the account. Click the count to open the account. |
You can search accounts by name, filter by predicted outcome (All, Churn, Neutral, Retention), toggle Has Actions to show only accounts with open action items, and adjust the time range using the filter bar above the table.
Expanding an account row
Click the chevron on any row to expand it. Revenue Review and Renewal Pipeline share the same expanded-row panel — sections appear in this order, and any section with nothing to show (no key topics, no stakeholder contacts, and so on) is skipped:
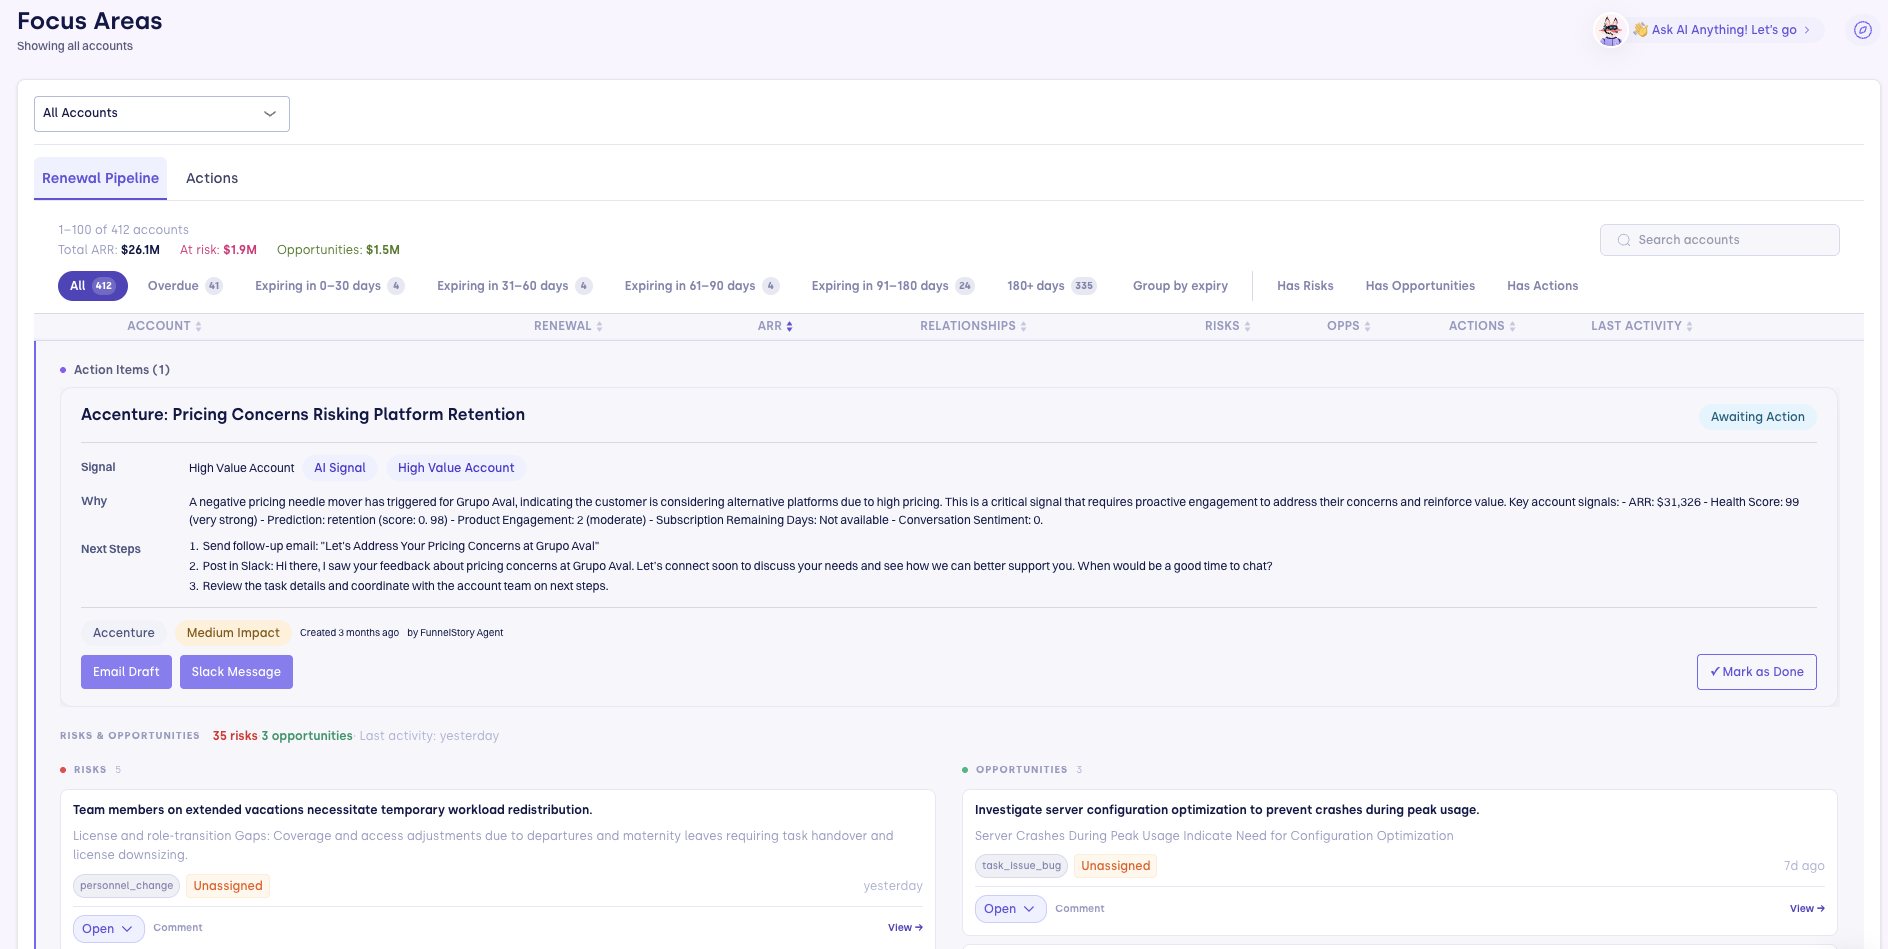
Action Items — Every open Action Card for the account, in the same card format used elsewhere in FunnelStory — title, reasoning, next steps, and outreach buttons. The header shows the count, for example "Action Items (3)".
Risks & Opportunities — A summary line ("5 risks · 2 opportunities · Last activity: 3d ago") followed by two columns, Risks and Opportunities, each listing up to five open Needle Movers for the account. A needle mover card here shows its own Action Item (or Action Items (N)) button when it has associated action items, opening a dialog listing those cards.
Last Meeting — Up to two of the account's most recent meetings, each with date, sentiment badge, title, attendees, an AI-generated summary, and a View full summary link. Shows "No meetings recorded" when there's no meeting data.
Relationship Intelligence — The account's coverage, engagement, and relationship health — the same compact panel used on the account's Dossier.
Last 90 Days — Active Concerns and Positive Signals callouts summarizing the account's recent trajectory.
Key Topics This Period — Tag pills of recurring themes from recent conversations, when any are available.
Stakeholder profile — A grid of contact cards for the account's tracked contacts.
Add Note — A text field for logging account notes directly from the table without navigating to the full account page.
A card's Email Draft or Slack Message button opens the same compose surface described in Action Cards — expand it to a full-width view for more room, or work in the compact dialog.
Relationship risk badges
The Relationships column uses color-coded badges:
| Badge | Meaning |
|---|---|
| Single Threaded (red dot) | Only one team member has recent engagement — high coverage risk |
| No Relationship (red dot) | No team members have recent conversations with this account |
Renewal Pipeline
On workspaces where it's enabled, Renewal Pipeline replaces Revenue Review with a view built specifically around prioritizing upcoming renewals, grouping accounts into cohorts by how soon they renew rather than a single flat table.
Table columns
| Column | Description |
|---|---|
| Account | Account name, with a tenure badge. |
| Renewal date | The renewal date, plus how many days away it is. |
| ARR | Contract value. |
| Relationships | Single-threaded risk indicator, same as Revenue Review. |
| Risks | Count of open negative-impact Needle Movers. |
| Opportunities | Count of open positive-impact Needle Movers. |
| Last Activity | The account's most recent product activity, meeting, ticket, or conversation, with a link and a relative "days ago" label. |
| Actions | Count of open Action Cards for the account. |
Use Group by expiry to cluster rows into renewal-proximity cohorts, or turn it off for a flat sortable list. The Has Risks, Has Opportunities, and Has Actions filters narrow the table to accounts with at least one open item of that kind, and a search box filters by account name.
Expanding an account row
Click the chevron on a row to expand it — the same accordion panel as Revenue Review's (Action Items, Risks & Opportunities, Last Meeting, Relationship Intelligence, Last 90 Days, Key Topics, Stakeholder profile, Add Note). See Expanding an account row above for the full breakdown.
Needle Movers
Displays open Needle Movers scoped to the accounts in the current focus mode, split into two lists:
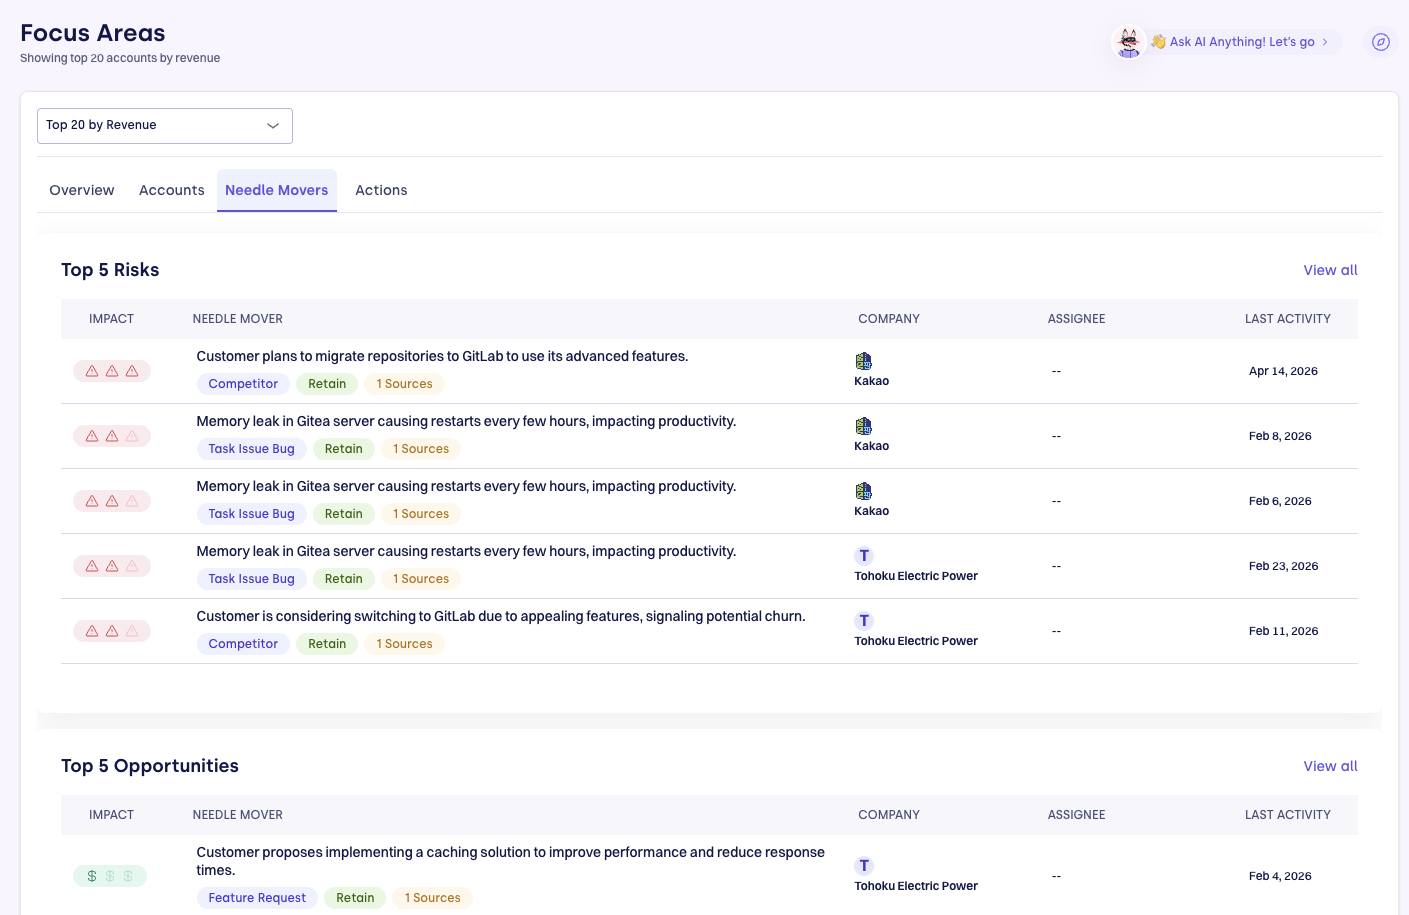
- Risks — Negative-impact Needle Movers (low, medium, and high severity).
- Opportunities — Positive-impact Needle Movers.
Each list shows up to five entries with a View All link that opens the full Needle Movers page pre-filtered to the same account set.
In My Book of Business and User's Book of Business modes, Needle Movers are filtered by the account assignee rather than an explicit account list.
Actions
The Actions tab surfaces AI-generated Action Cards for the accounts in the current focus mode. Each card is a task created by an AI Agent and contains a recommended action, the signal that triggered it, reasoning, next steps, and pre-drafted outreach.
A header bar shows the total count of actions across all accounts (for example, "14 actions across 8 accounts").
Actions Needed toggle — When enabled (the default-off state), the list shows only tasks in Awaiting Action or In Progress status. Turn it off to include completed and expired tasks as well.
See Action Cards for a full description of the card format and how the AI generates them.
Related
- Accounts View — the full accounts list with advanced filtering.
- Account Dossier — the per-account view that Renewal Pipeline's expanded rows draw from.
- Needle Movers — workspace-wide signal feed.
- Action Cards — how AI Agents create and populate the Actions tab.
- Relationship Risk Configuration — configure the thresholds that drive Single-Threaded Risk and Engagement Drop flags.